AI-Driven Revenue Cycle Intelligence
Your practice may be leaving $454K–$2.1M on the table every year.
We benchmark your Revenue Cycle KPIs against 4,500+ providers and deliver a practice-specific report with root causes and a corrective action roadmap — in two weeks, at no cost.
Benchmarked against MGMA · HFMA · AMA · CMS 2025 · Validated across 12 physician specialties
4,500+
Providers benchmarked
13
Critical KPIs evaluated
2-4 wks
To your full report
$0
No cost, no obligation
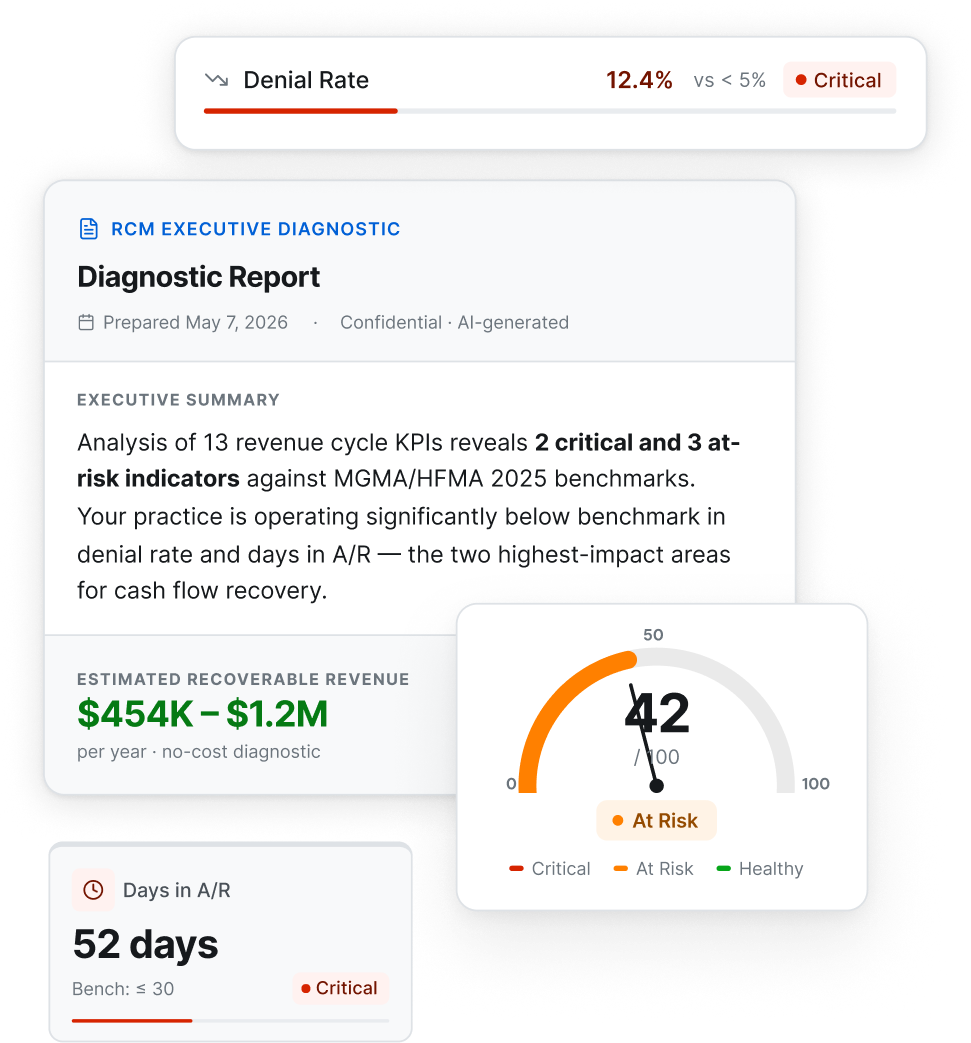
Sample Diagnostic Output
What we find — and what it costs you
Here's a sample of what a typical mid-sized practice looks like against national benchmarks. The gaps are almost always larger than billing managers expect.
Performance Classification
How we classify performance
Every KPI is assigned a Green / Yellow / Red rating based on validated national thresholds. Yellow is a monitoring alert — not an acceptable operating state.
KPI Measure
Your Benchmark
Green
Yellow — Monitor
Red — Action Required
Days in A/R
AR velocity & cash flow impact
< 44 days
< 44 days
46–64 days
65+ days
A/R Aging > 90 Days
Write-off risk indicator
≤ 15%
≤ 15%
16–30%
31%+
Net Collections % by DOS
Revenue capture efficiency
≥ 95%
≥ 95%
85–94%
≤ 84%
First Pass Pay Rate
Clean claim submission quality
≥ 92%
≥ 92%
80–91%
< 80%
Any KPI in Yellow for two consecutive months must be escalated to the billing manager with a root cause memo. Sustained Yellow predicts Red outcomes within 90 days in 73% of observed cases.
Financial Opportunity by KPI
How much is each gap costing you?
Estimated annual revenue impact for a 12-provider practice ($5M–$15M in charges, 5–10 providers).
Estimated annual opportunity
$454K–$2.1M
per year · $5M–$15M charges practice
Tap or hover any segment to see how the math works.
Source: HFMA MAP Keys 2024 · MGMA DataDive 2024 · Premier Inc. · Kodiak Revenue Cycle Analytics 2024
RCM Health Verdict
Where practices typically break down
We evaluate every stage of the revenue cycle and assign a traffic-light verdict with a quantified annual risk range per provider.
Front-end prevention
Monitor
Point-of-service collections & eligibility verification gaps. Front-end failures create back-end complexity at a 3:1 ratio.
Mid-cycle process optimization
Monitor
E&M undercoding and claim submission lag. E&M coding distribution by provider identifies both undercoding and overcoding patterns.
Back-end reconciliation
Action Required
Unworked denials and aging A/R. The back-end absorbs the compounded failures of both front-end and mid-cycle stages.
Get your free diagnostic in 2-4 weeks
Two steps. Zero cost. Most practices identify $200K–$500K+ in actionable opportunity before the first follow-up conversation.
No obligation · No contract · No fee · Most practices identify $200K–$500K+ within 2-4 weeks
Intro Call
Walk through your current RCM pain points. No commitment required.
Practice Diagnostic
Provide read-only EMR & PMS access. Your personalized benchmark report in 2-4 weeks — timeline depends on EMR integration or manual data processing
Review & Decide
We walk through findings together. Move forward if it makes sense. Keep the report either way.