$20 Billion. Every year. Chasing money you already earned.
American hospitals and health systems spent $20 billion in 2024 fighting denied claims — the majority originating from prior authorization failures. This is not a revenue cycle problem. It is a structural margin crisis requiring executive action.
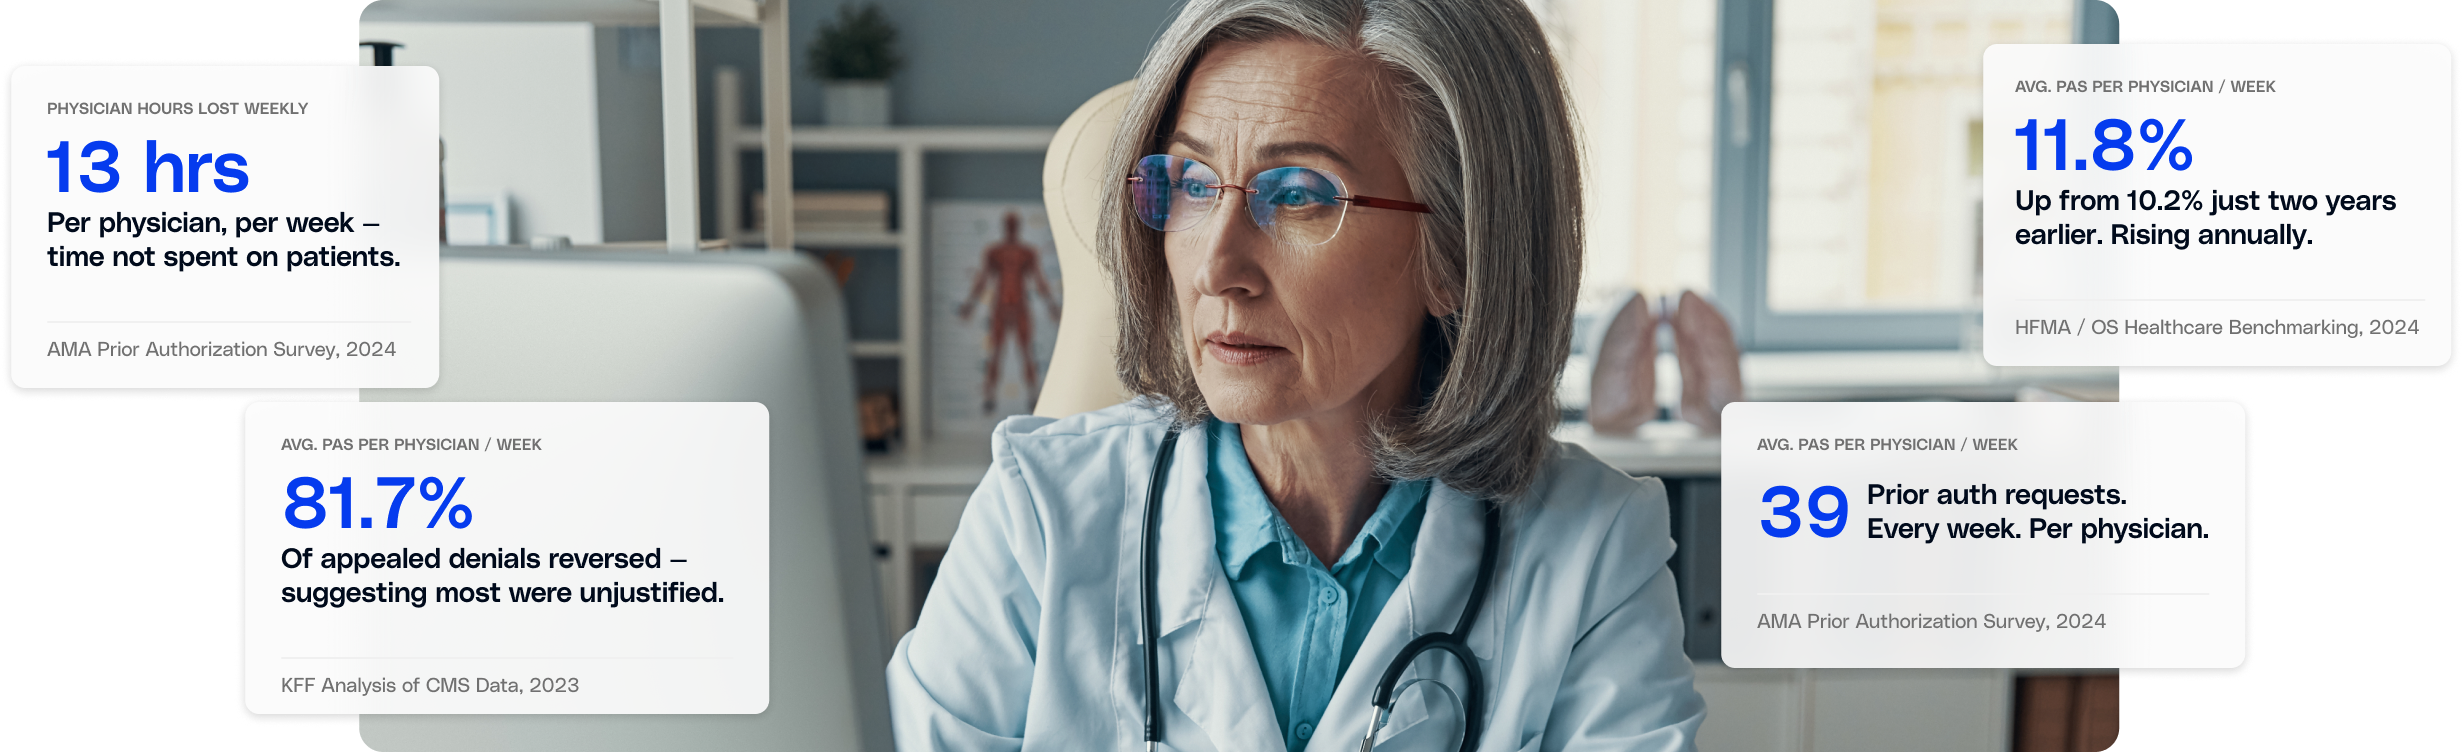
Prior authorization was designed as a cost-control mechanism. It has become a profit-maximization instrument. Health systems bear the administrative and financial burden of a process they did not design and cannot opt out of.
$262B
In claims initially denied annually
Nearly one in nine dollars submitted never clears on the first pass. For a $1 billion health system, an 11.8% denial rate represents $118 million in revenue requiring costly rework before collection.
HFMA / OIG Benchmarking Report, 2024
$57.23
Administrative cost per denied claim
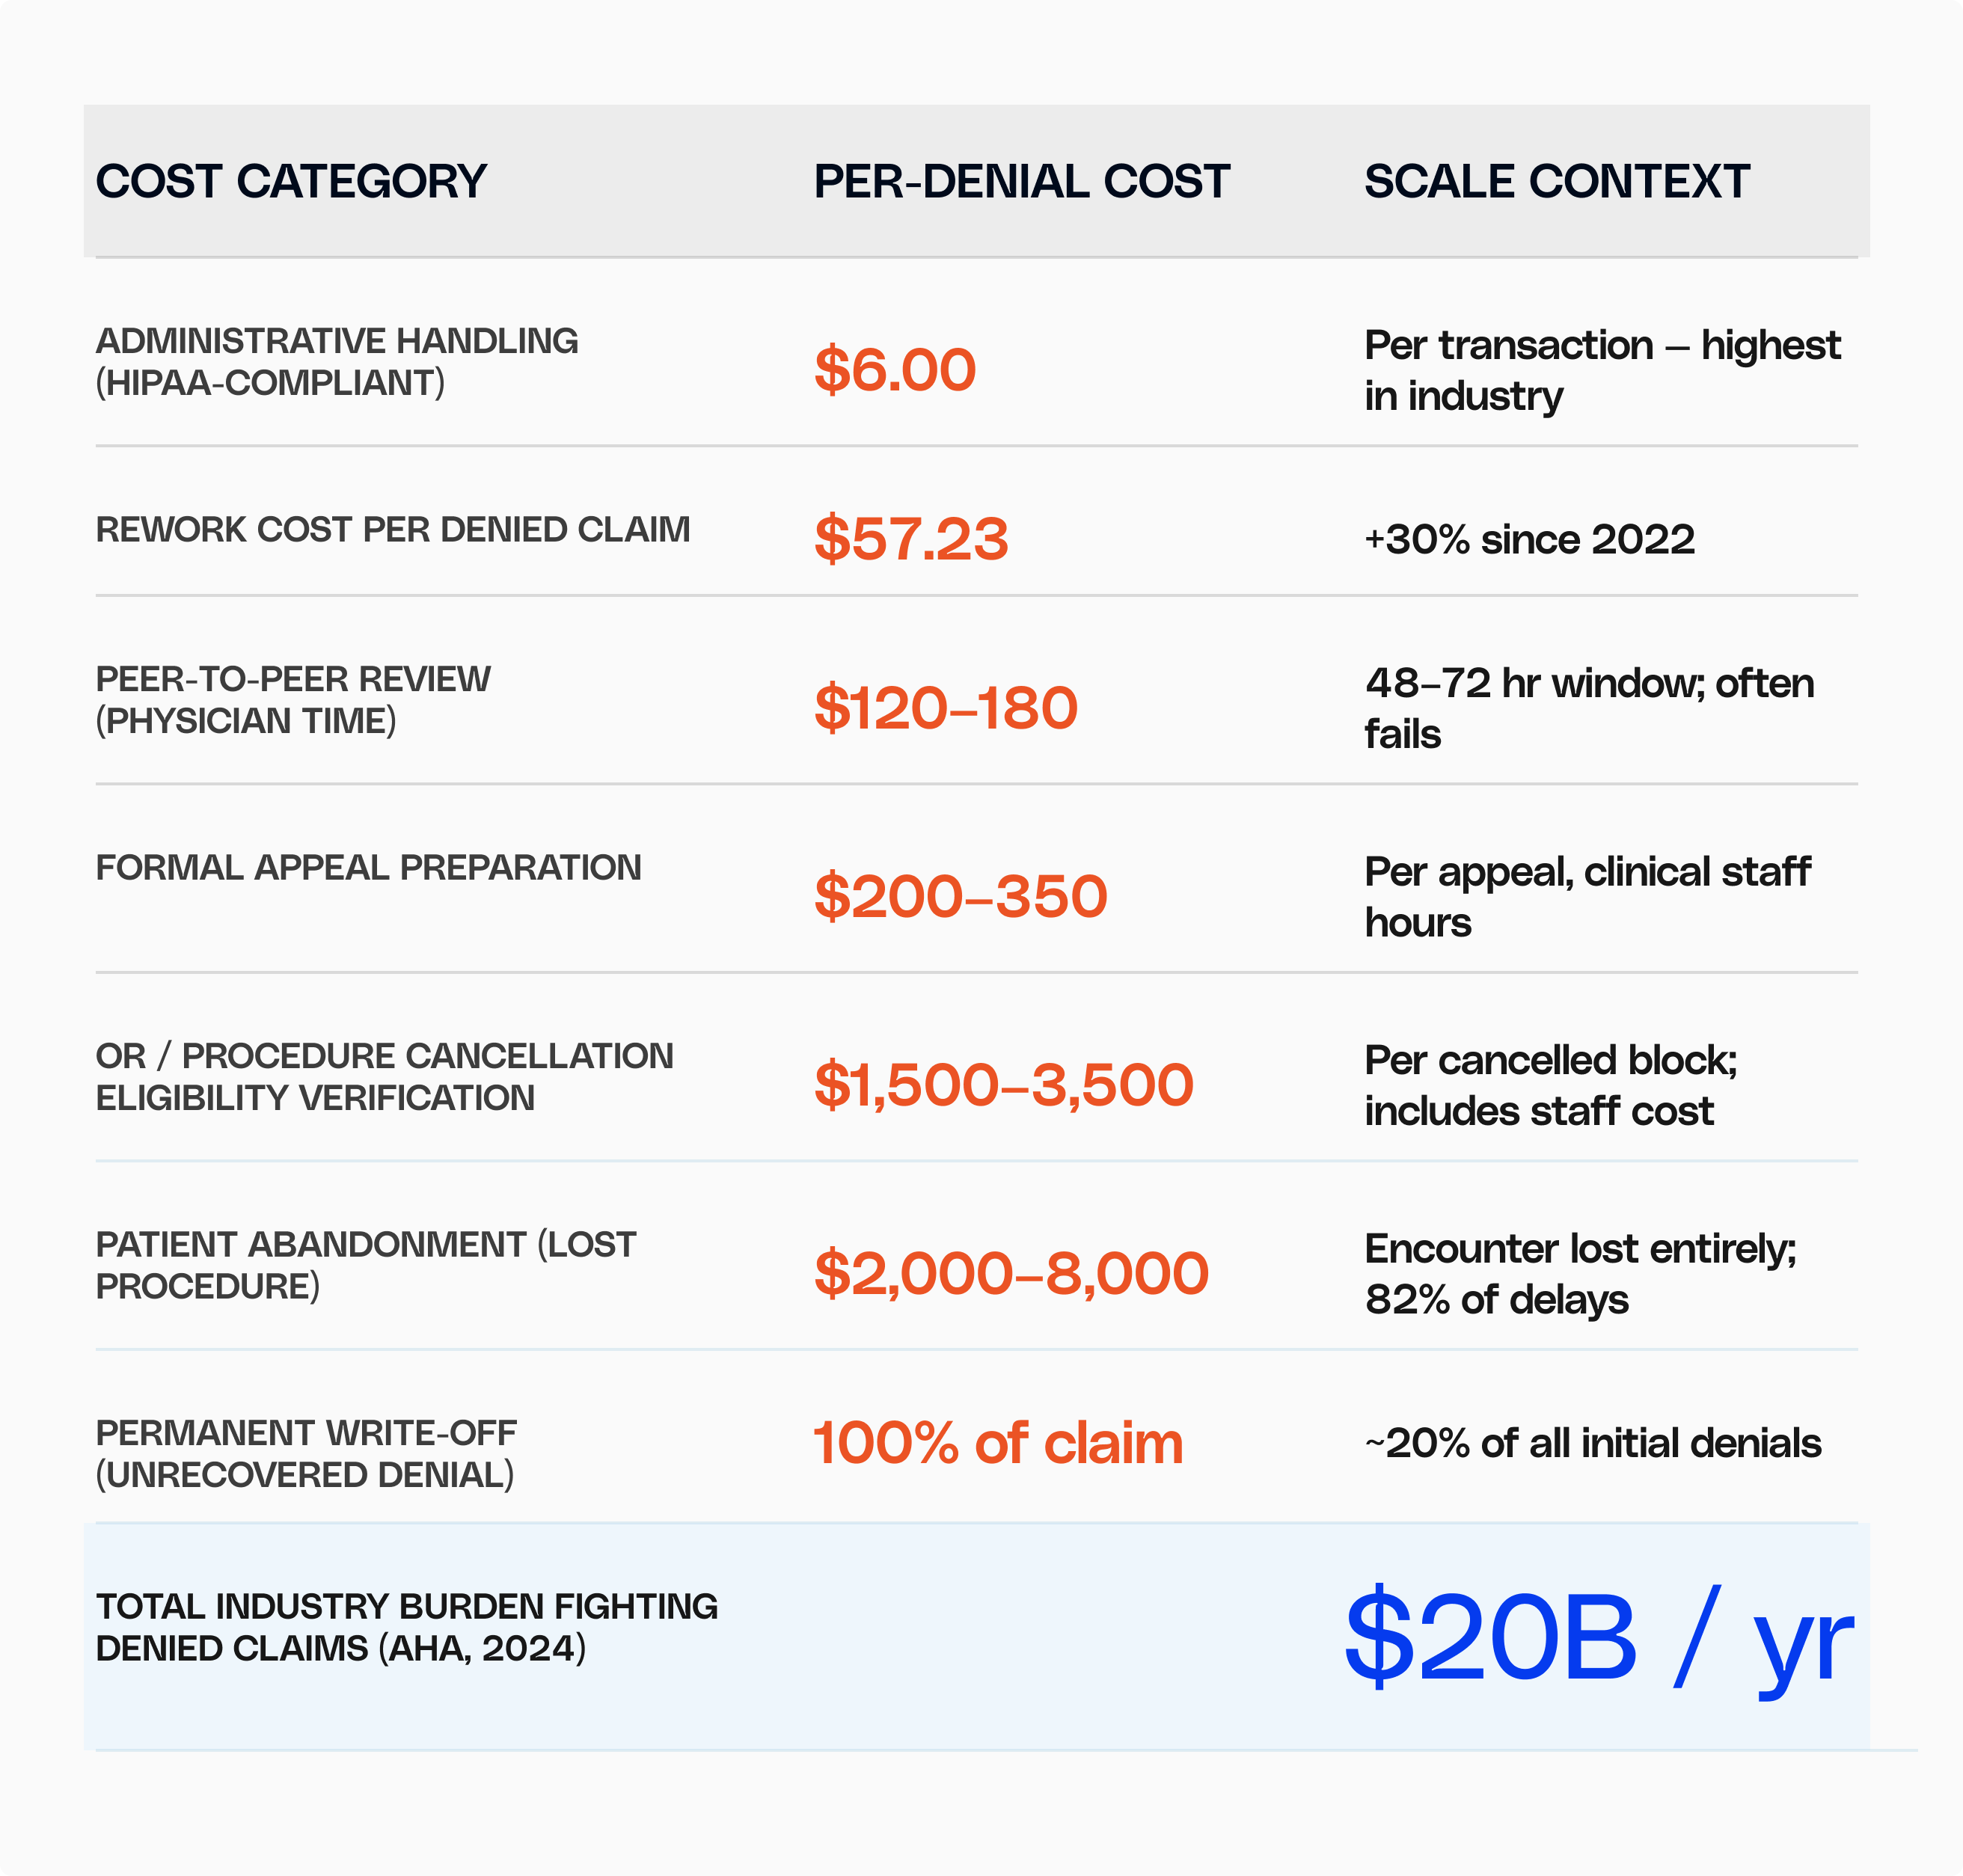
Up 30% from $43.84 in 2022. Every denied claim requires re-documentation, resubmission, peer review coordination, or appeal — labor that compounds at scale. Health systems receive no reimbursement for this burden.
HFMA / Aptarro Analysis of Claim Remit Data, 2023
40%
Of physicians forced to hire PA-only staff
Four in ten physician practices have created dedicated roles whose sole function is to process prior authorizations. This is not scale — it is structural inefficiency masked as operational necessity.
AMA Prior Authorization Survey, 2024
50M
PA requests in Medicare Advantage alone
In 2023, Medicare Advantage plans received 50 million prior authorization requests from enrollees' providers. With 99% of MA patients enrolled in PA-required plans, every admission, procedure, and imaging order is a potential delay.
KFF Analysis of CMS Data, 2023
82%
Of patients abandon treatment after PA delays
Patient abandonment is a care quality crisis and a revenue quality crisis simultaneously. Patients who abandon treatment return sicker, generating higher-acuity encounters under worse financial conditions — for both patient and system.
AMA Prior Authorization Survey, 2024
36%
Of commercial A/R aged over 90 days
Aged A/R greater than 90 days reached 36% for commercial claims by mid-2023 — up from 27% in 2020. The leading driver is initially denied claims requiring additional documentation and rework cycles before resolution.
Kodiak Solutions Revenue Cycle Benchmarking, 2023
Where CFOs Are Bleeding
The financial anatomy of a PA failure.
A single missed or incorrectly documented prior authorization triggers a cascade — from claim rejection to write-off — that most revenue cycle systems track only after the damage is done. The true cost is three to five times the face value of the denied claim.
We don’t train our models on your data
Front-end revenue cycle errors — including missed prior authorizations — are the top cause of claim denials, accounting for 32.5% of total denials according to 2024 SSI data.
Each failure generates compounding costs: re-documentation time, resubmission labor, peer-to-peer physician reviews, formal appeal preparation, and in approximately 20% of cases, a permanent write-off.
The asymmetry is stark. Payers use AI to deny claims in milliseconds. Most health systems still respond with manual teams navigating fax queues and payer web portals. The operational gap widens each quarter that automation is delayed.
"Denial rates are not small, static, or trivial. For many organizations, these costs quietly compound into millions of dollars in avoidable expenses each year. A 5% denial rate in a $1B hospital means $50 million in lost revenue."
HFMA / OIG Denial Management Report, 2024
"Within one year, one health system recorded an 83% clean submission rate for prior authorizations, reduced authorization turnaround times by 80%, decreased time spent on PAs by 2,841 hours, and saved $644,000 in avoided write-offs."
HFMA, Battle of the Bots: AI in Revenue Cycle, 2024
The Regulatory Moment
The window for deliberate action is closing.
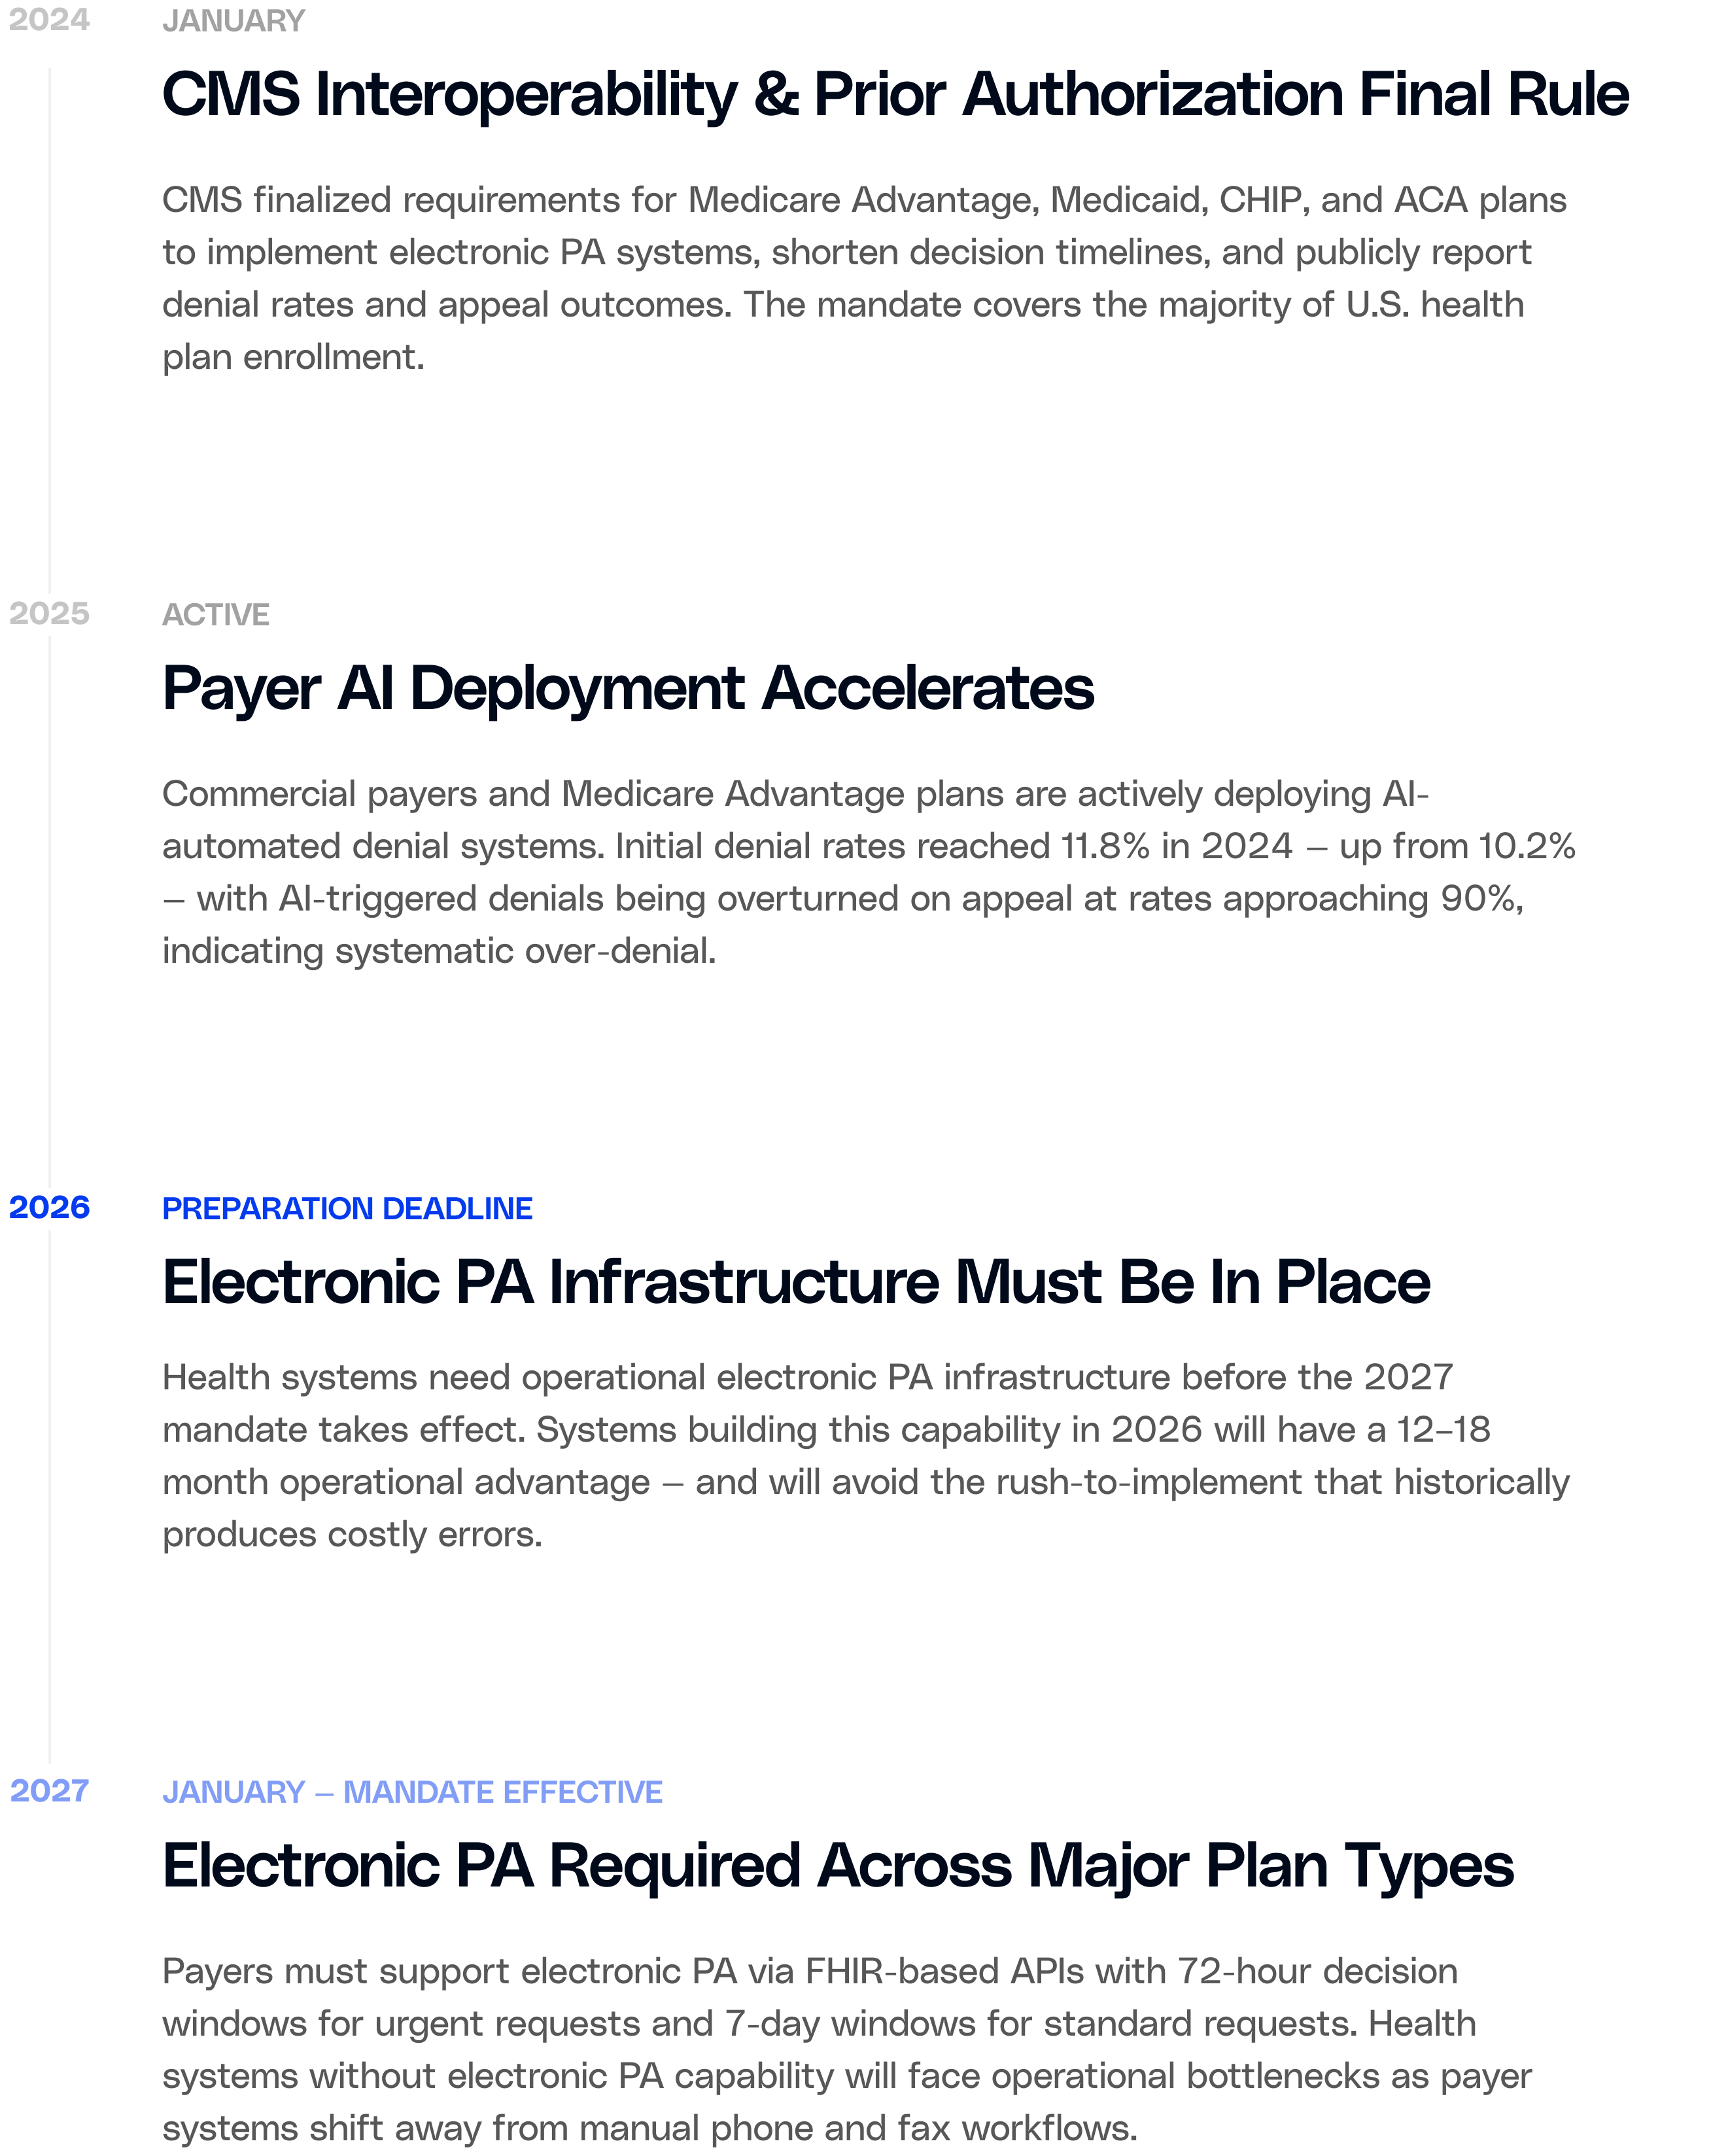
CMS has mandated electronic prior authorization by 2027. Simultaneously, payers are deploying AI-accelerated denial systems at scale. Health systems that wait for "more information" are ceding operational ground that will take years to recover.
Structural Threat — AI Asymmetry
Payers armed with AI. Providers still on fax.
Commercial payers have invested heavily in AI-driven utilization management. One AI system allegedly drove 50–75% of denial decisions automatically. Health systems processing PAs manually are structurally disadvantaged in a conflict where response time and documentation completeness determine outcomes.
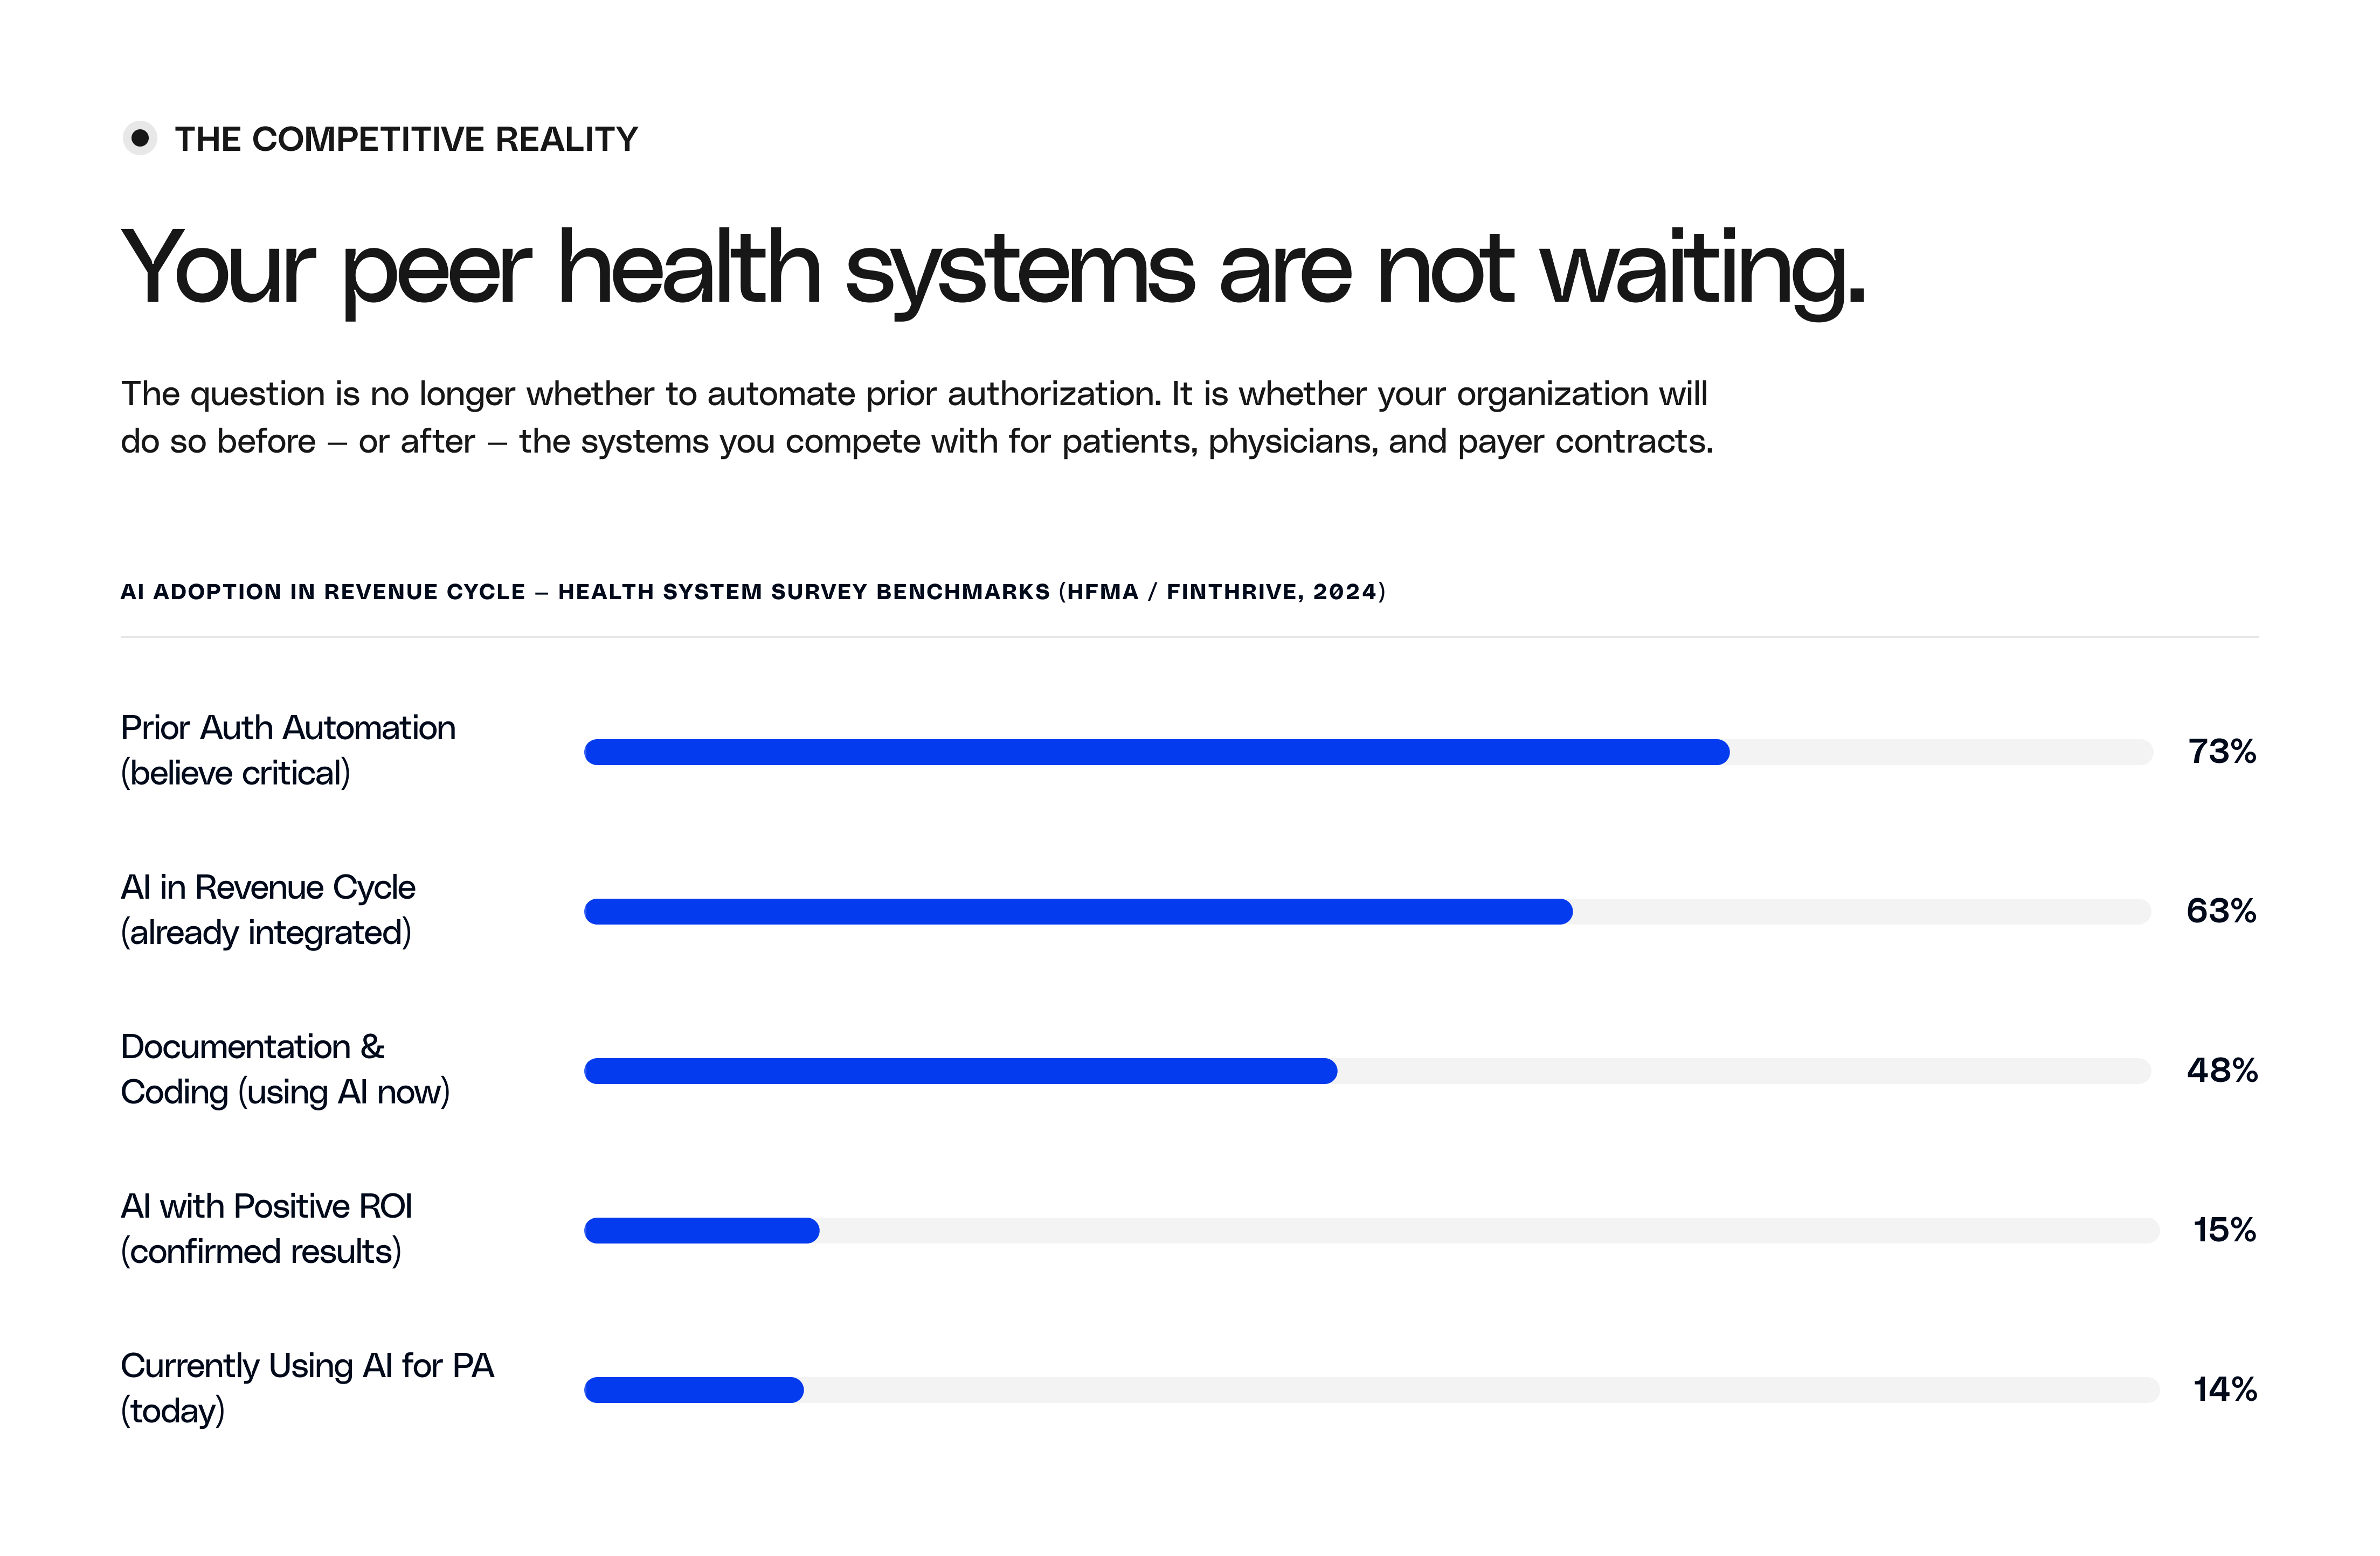
73%
of health systems believe AI will have the biggest impact on PA — HFMA/FinThrive, 2024
Financial Threat — Revenue at Risk
Denial rates compound faster than staff can scale.
Denial rates have risen from 8% in 2021 to 11.8% in 2024 for commercial claims — a 47% increase in three years. Adding headcount to manage this trajectory is a losing strategy. Each percentage point of denial rate increase on a $500M revenue base represents $5M in additional rework or write-off exposure.
73%
of finance leaders report denials increasing across all payers — Experian Health, 2024
Structural Threat — AI Asymmetry
Early-moving health systems are locking in advantage.
Health systems that have deployed automated PA workflows are reporting 80%+ reductions in turnaround time and significant reductions in write-offs. Clean submission rates above 83% are achievable within 12 months of deployment. Systems that automate first will be the preferred high-volume referral destination as payer relationships increasingly reward administrative efficiency.
73%
of healthcare organizations have already integrated AI-powered automation in revenue cycle — HFMA, 2024
Innovaccer Autonomy
What measurable recovery looks like in practice.
Innovaccer Autonomy deploys intelligent agents across the prior authorization workflow — from intake to submission to appeal — replacing the manual coordination that drives delays, errors, and denials with autonomous execution grounded in clinical context.
90%
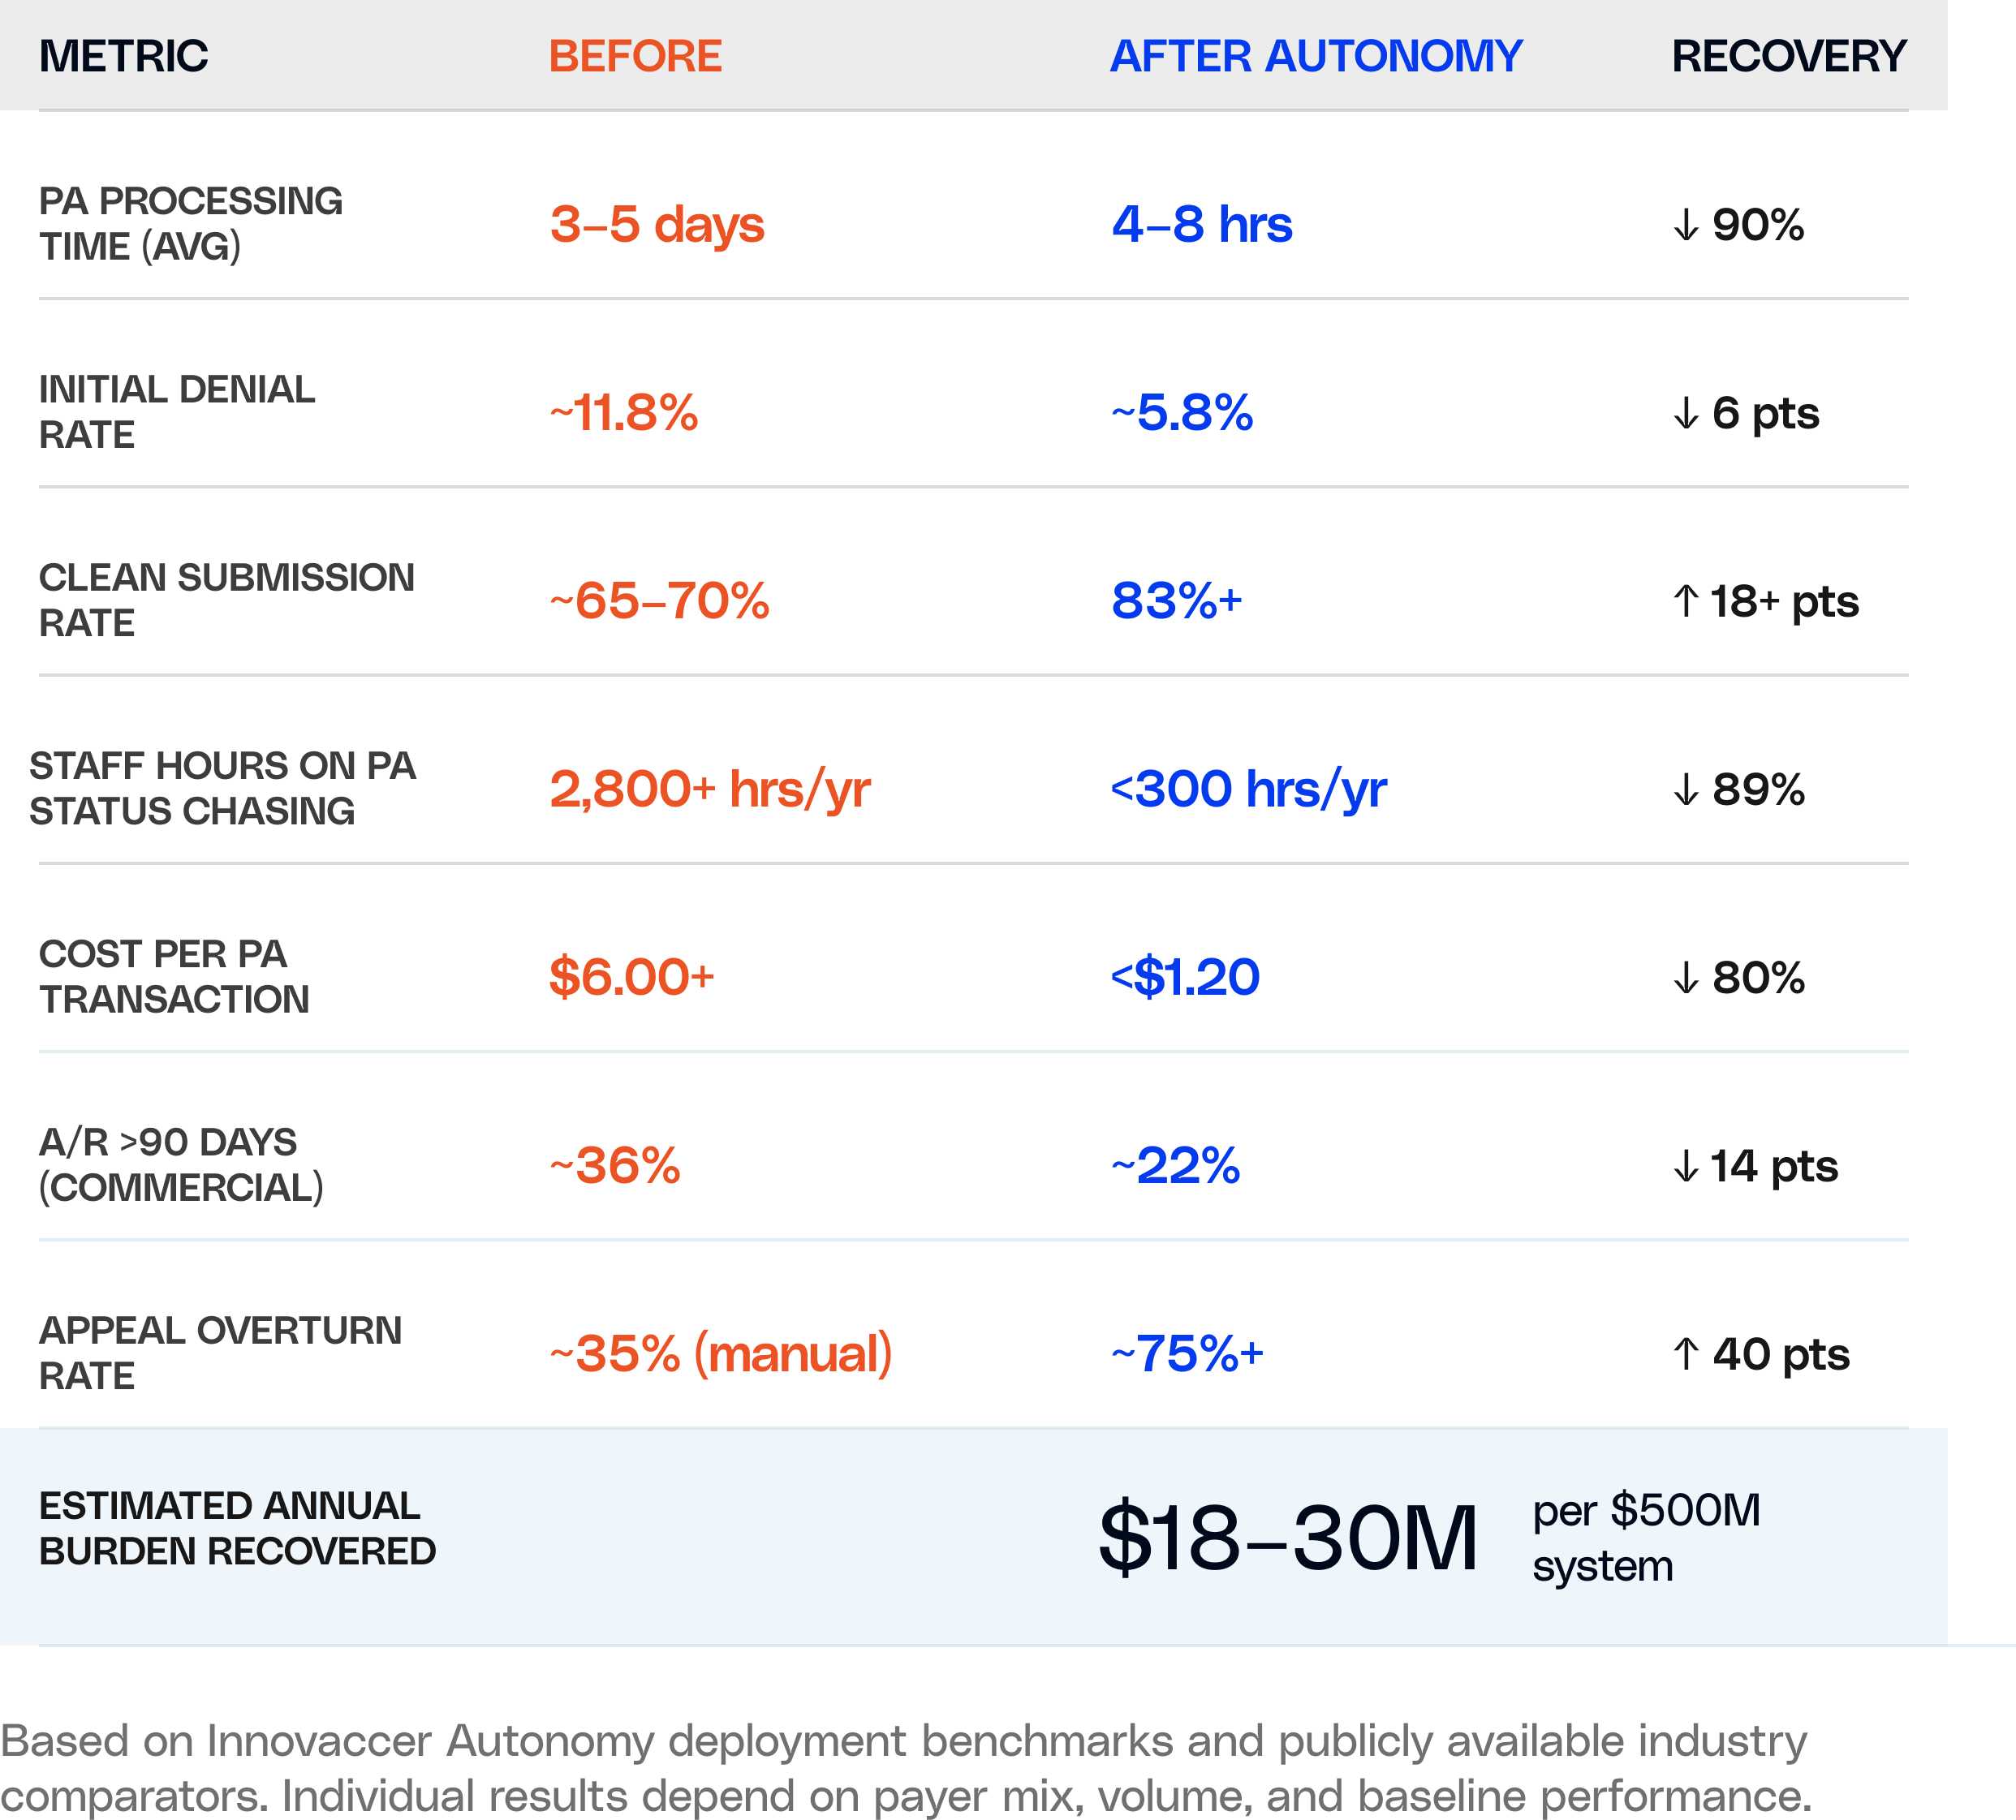
Reduction in PA Processing Time
Authorization requests that once required days of manual coordination, phone calls, and status chasing are resolved in hours. Autonomous agents navigate payer portals, attach clinical documentation, and track status without human intervention at each step.
Typical system: 3–5 days → With Autonomy: 4–8 hours
6%
Reduction in Denial Rate
Autonomous pre-submission review catches the documentation gaps, coding mismatches, and payer-specific requirement failures that generate the majority of preventable denials — before the claim is ever submitted. A 6% reduction in denials on a $1B revenue base recovers $60M in claims that previously required rework or were written off.
On $500M revenue: ~$30M in recovered or protected claims
Step 1
Intake & Eligibility Verification
Autonomous agents verify insurance eligibility, confirm PA requirements by payer and procedure, and flag missing documentation at point of scheduling — not after the fact.
Step 2
Clinical Documentation Assembly
Agents retrieve and organize relevant clinical records, apply payer-specific medical necessity criteria, and auto-populate authorization request templates — reducing manual data entry to near zero.
Step 3
Submission & Status Tracking
Electronic submission via payer APIs or portal automation, with autonomous status polling that eliminates the manual follow-up calls consuming 2,800+ staff hours per year at a typical mid-size system.
Step 4
Denial Interception & Appeal
Electronic submission via payer APIs or portal automation, with autonomous status polling that eliminates the manual follow-up calls consuming 2,800+ staff hours per year at a typical mid-size system.
160+
Health Systems on Platform
$2.53B
Cumulative Savings Delivered
160M+
FHIR Resources
The CFO Calculation
Before automation. After Autonomy.
The numbers below reflect operational benchmarks from Innovaccer Autonomy deployments in comparable health systems. Your system's profile will vary — which is precisely what the confidential briefing quantifies.
The math is not complicated. The decision is.
Most prior authorization transformation initiatives fail not because the technology is wrong, but because the ROI case is built against list costs rather than true system-wide burden. When you account for physician time, denied-claim rework, OR cancellations, patient abandonment, and appeal labor — the case for autonomous PA is not marginal. It is categorical.
$30M+
Estimated annual PA-related burden for a typical $500M net revenue health system, once all cost categories are included
The table to the right models a representative 400-bed system operating at $600M net patient revenue with 250 physicians completing an average of 39 PAs per week. Adjust the scale to your organization's profile during the briefing.
Model based on AMA, HFMA, AHA, and Kodiak Solutions benchmarks. Innovaccer customer outcomes data on file.
The Operational Gap
Early movers are compounding their advantage quarterly.
Health systems that deployed automated PA in 2023–2024 are entering 2025 with clean submission rates above 83%, reduced A/R aging, and PA staff redeployed to higher-value work. The compounding effect — cleaner data, more accurate payer rules libraries, better denial pattern recognition — means the gap between first movers and laggards widens each year, not just each quarter.
HFMA 2024: Early movers report 80%+ reduction in PA turnaround time within 12 months of deployment
The Operational Gap
PA burden is a physician recruitment and retention issue.
With 40% of practices now hiring staff exclusively for prior authorizations, and physicians spending 13 hours per week on PA tasks, administrative burden is consistently cited among the top three drivers of burnout and departure. Health systems that demonstrably reduce PA burden attract and retain physicians who have choices — and lose them to competitors that do.
AMA 2024: 93% of physicians say PA delays patient care; 29% report PA-caused patient hospitalization
As payers move toward value-based and risk-sharing arrangements, administrative efficiency — clean claim rates, low denial rates, timely documentation — increasingly factors into contract negotiations and performance benchmarks. Health systems that cannot demonstrate operational discipline at the transaction level will negotiate from a weaker position in the contracts that increasingly determine long-run financial performance.
CMS 2027 mandate accelerates payer transition to electronic PA — systems not ready face operational disruption
Innovaccer Autonomy
Your prior auth profile. Quantified.
A 45-minute working session, not a sales call.
Designed for CFOs, VPs of Revenue Cycle, and Chief Operating Officers. Bring your denial rate data and payer mix. We'll bring the model.
Your system's estimated annual PA burden, fully loaded across all cost categories
Denial root-cause analysis by payer type and service line, benchmarked to peer systems
Modeled impact of 90% processing time reduction and 6% denial rate reduction against your specific revenue profile
CMS 2027 readiness assessment: where your current workflow stands and what changes are required
A competitive positioning analysis: where peer systems in your market are in the automation journey
A realistic implementation timeline and operational transition plan
Thank you! Your submission has been received!
Oops! Something went wrong while submitting the form.
Organizational Readiness
Five questions every CFO should be able to answer.
Before your next board cycle, these operational questions should have data-backed answers. If they do not, the cost of not knowing is already showing up in your margins.
What is our true cost per prior authorization — including physician time?
Most CFOs report only transaction cost ($6). Total burden including physician time, appeal labor, and patient abandonment is typically $200–400 per denied auth.
What percentage of our denials are from PA failures vs. other causes?
PA and front-end revenue cycle errors now account for 32.5% of total denials. Most RCM dashboards do not isolate PA-origin denials from eligibility or coding failures.
How many FTE hours per week does PA consume across clinical and administrative staff?
13 hours per physician per week, plus dedicated PA staff. A 200-physician system is spending 2,600+ physician hours per week — equivalent to 65 FTEs — on prior authorization alone.
Are we prepared for payer AI-accelerated denials in the next 12–18 months?
Payer AI is already driving denial rates up 1–5% annually per plan type. Systems without automated PA response capabilities are structurally disadvantaged in this environment.
Is our PA workflow prepared for the CMS 2027 electronic mandate?
Systems that begin electronic PA infrastructure now will have 18+ months of operational maturity before the mandate — and avoid the disruption of rushed implementation.